

Facebook Lean Canvas: How to Model a Multi-sided Business
Today I will show you how to model a multi-sided business using a Lean Canvas. Products like Facebook, Google, Twitter, and YouTube all fall into this category.
This post builds upon an earlier one on modeling direct business models, which I recommend reading first if you haven’t already.
Unlike a direct business model where your users become your customers, a multi-sided business model is a multi-actor model where your users and customers are distinct segments.
For a simple distinction:
Users use your product, while customers pay for your product.
The Multi-sided Business Model Story
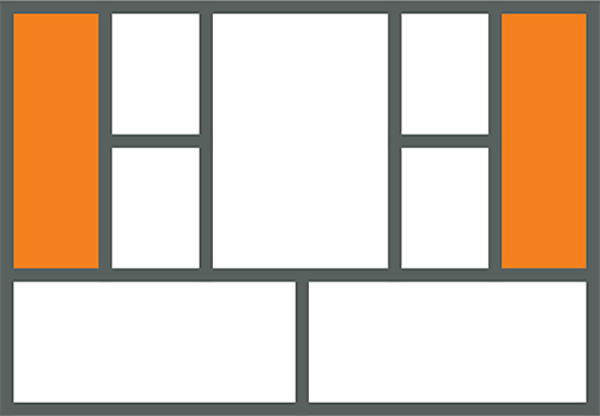
Every business model needs to be able to tell the story of how it will create, deliver, and capture value.
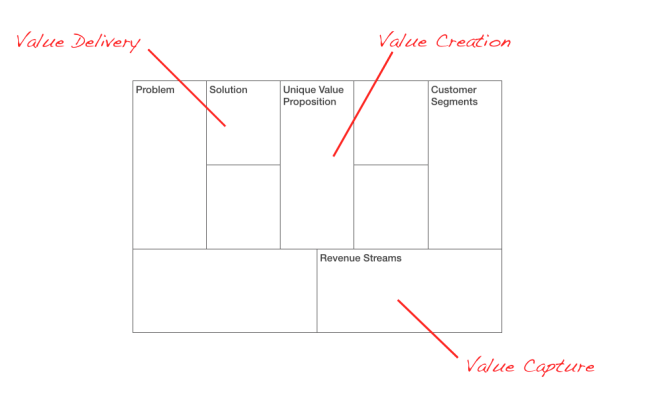
In a direct business model, value is created and delivered to users, and when some of this value is captured back as money, those users are then converted into customers.
As long as you create more value for your customers than you capture back, you generally have a compelling value proposition. And as long as you capture back more value than it costs you to deliver it, you generally have a sustainable business model.
In a multi-sided model, however, you have two sides to this story. Here the goal is still to create, deliver, and capture value from users, but that value is monetized through different customers — making it a multi-actor model.
Let's take Facebook as an example. Facebook creates and delivers value to its users through its social network, but it doesn’t charge its users directly. That said, they still capture some of this value back, albeit through a derivative currency — user attention in this case.
Facebook then trades this derivative currency on a secondary market of advertisers (their customers) who pay to reach these users.
We can tell a very similar story around Google’s search engine business model replacing their search engine for Facebook’s social network.
In both these examples, the derivative currency is attention which is monetized by converting attention (from users) into clicks for advertisers (their customers).
Attention isn’t the only kind of derivative currency. Other examples of derivative assets that can be similarly traded on secondary markets are user-generated content (YouTube’s model is an example of this) and big data (Klout’s model is an example of this).
Capturing the Business Model Story
When modeling a multi-sided business on a Lean Canvas, start by labeling both your actors (users and customers) under the Customer Segment canvas box, and then follow this 3 part process:
1. Model your users before your customers
This is because users are typically the riskier segment in these models.
We can, for instance, be reasonably certain that an advertiser will “pay something” to reach a “large enough targeted audience”. I’ll get to how you might estimate what that “something” might be, but the more immediate and riskier question is how you capture the attention of a “large enough targeted audience” in the first place.
You only get to capture value after you create value for your users.
In other words, you must first tackle what’s in it for your users. Place that “promise” under your unique value proposition box.
Next, identify the quid pro quo, i.e., how you capture back some of this value from users and place this “derivative currency” under your revenue streams box.
Here’s what an early Lean Canvas of Facebook might have looked like:
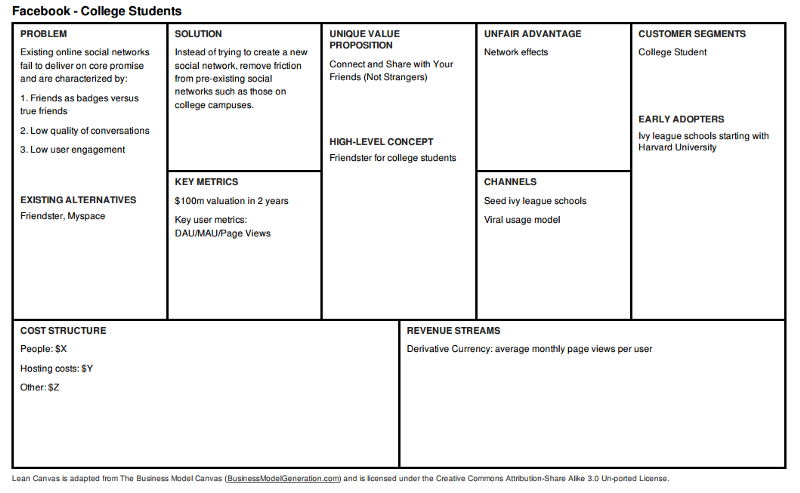
Notes:
- I’m assuming Facebook’s original vision was around college students only at first, which they expanded later. Otherwise, I would have placed the total addressable segment (much larger mainstream market) on top, with college students as the early adopters.
- The promise or UVP here is connecting and sharing with your close college friends versus strangers.
- The derivative currency is user attention which I’m measuring using the average number of monthly page views per user.
- I’ve also placed a minimum success criteria goal of reaching a $100m valuation within two years. Remember, there is no right or wrong answer here, and this number is more a function of personal ambition and other analogs that support that ambition. At the time of Facebook’s launch, at least two other analogs (Friendster and Myspace) grew to ~$50m valuations within the first year. We also know that Myspace tried to purchase Facebook after its first year but was turned down by Mark Zuckerberg’s asking price of $75m. So at least then, Zuckerburg’s minimum success criteria was a $75m valuation after one year (source).
2. Next, model your customers
After the first pass of modeling your users, it’s time to shift to your customers. If you are doing this on paper, you can try keeping everything on the same page using different colors for each actor, or if you run out of space, create two separate canvases.
If you are using the online Lean Canvas tool, we built a nifty hashtag feature that allows you to easily model both sides on a single canvas.
Here’s how it works:
- You label your business model actors using a unique hashtag, e.g., #user, #customer. This will automatically color-code these customer segments for you.
- You can then use these hashtags anywhere on the canvas to highlight a #user or #customer assumption.
- Clicking on the buttons above the canvas lets you toggle (show and hide) the different sides of the model.
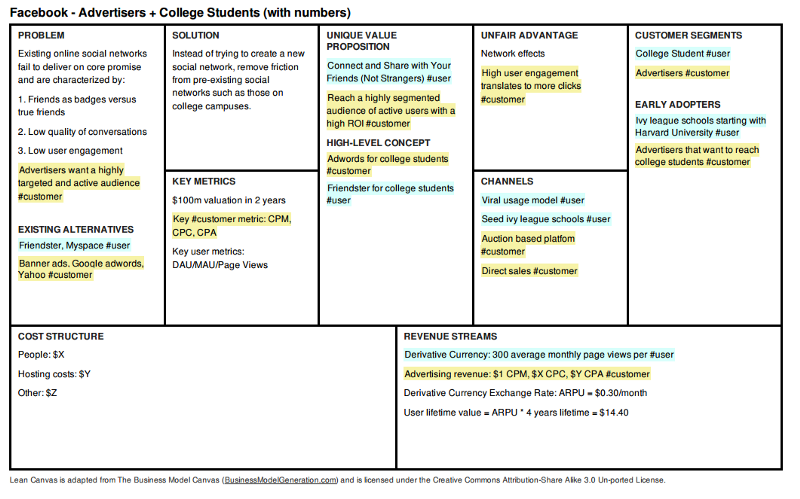
Here’s what the Facebook model with the customer side might have looked like:
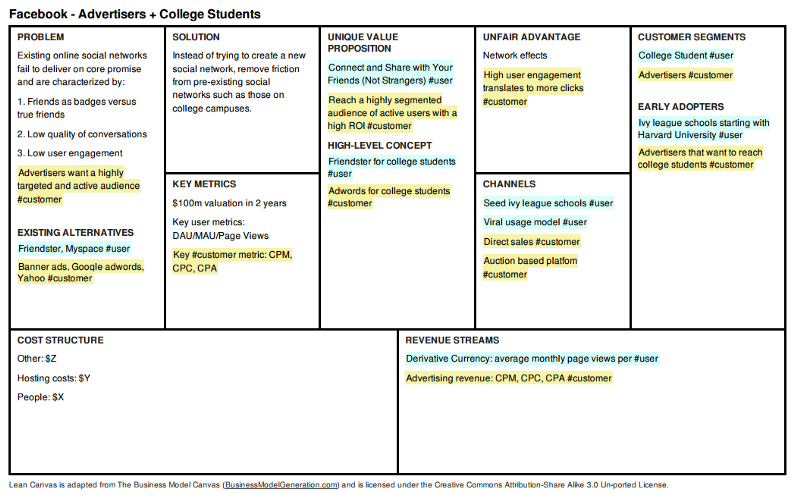
Notes:
- Here the problem/promise for advertisers is as old as advertising itself: “Help me reach more people at higher ROI.” The existing alternatives were also well known as online advertising was already a mature marketplace. The bigger leap of faith for the advertiser was getting them to believe that an ad placed under a social networking context could perform or even outperform an ad placed under a search engine context.
- For the reasons above, I don’t need to get that deep on the canvas to model customers' motivations. This isn’t always true, though. In a big data play, for instance, you might be building a mobile game to collect data from users that you then sell to health insurance providers. I can envision lots of uncertainty on both sides.
- Under the revenue streams from customers, I placed the three main ways of pricing advertising: Cost Per Thousand Impressions (CPM), Cost Per Click (CPC), and Cost Per Acquisition (CPA). For a short primer on these, check out this article.
3. Finally, calculate your derivative currency exchange rate
The derivative currency exchange rate is the current market rate for your asset.
In other words, we need to model the conversion ratio from the user payment currency (monthly page views per user) to the customer payment currency (CPM, CPA, CPC).
I’ll start by getting more specific on pricing.
For modeling purposes, I like to start with the simplest of the three pricing approaches (CPM) because it takes fewer steps (assumptions) to convert impressions into a number of users.
You can certainly use CPC and CPA, but they’ll require building a few additional assumptions into your model (that are derivatives of the number of impressions), such as your click-through rate. I’ll leave that for you as an exercise.
The best place to look for pricing ballparks is in your existing alternatives box, i.e., what are customers using and buying today?
The best evidence of monetizable pain is a check being written.
In the case of Facebook, Google Adwords was probably the closest (and most successful) existing alternative to model against at the time. Before Adwords, there were banner ads. Before that, radio, tv, print, billboards, etc. Advertisers have been paying to reach large enough targeted audiences for some time now.
This, by the way, is a great example of an old “job” with several existing alternatives (still in use) that transcend both time and categories. As a side note, I’ve been incorporating the jobs-to-be-done framework in my work lately and will get more into this in future posts.
Coming back to pricing, back in 2004, the average cost per thousand impressions (CPM) ranged from $1-$3 (source).
These were numbers I found through a quick 5-minute search. It’s hard going back ten years, but we’ll use these numbers for now in the model.
In other multi-sided businesses where these numbers may not be as readily available, you might have to guesstimate based on the value created (ROI) for your customers or, better yet, get out of the building and go test some pricing with your target customers.
In Gary Vaynerchuck’s book: “Crush It”, he describes how to simply cold call every relevant company that is buying space on Google to test pricing.
Once you have a starting price anchor, you can decide to price your solution at either a premium or a discount, given your unique value proposition.
Let's assume in this example that we choose a strategy to price our CPM at the lower end of the range ($1.00), which is lower than the alternatives ($1-$3). I went lower because I expect search engine users to behave very differently from social network users, and that difference was still highly uncertain for advertisers at the time. From the article above, you can also see a trend of rapidly declining CPM rates over time.
To get to the derivative currency exchange rate, we need to model the user-side behavior that connects to CPM, which is the average number of monthly page views per user.
Here I am going to assume that a user, on average, will view ten pages per day or 300 pages per month.
This, again, is not a number pulled out of thin air.
In 2010, Facebook’s closest rival, Hi5, had an average of 351.2 monthly page views per user. MySpace came in at 261.8 monthly page views per user (source). Facebook again outperformed both of these with 661.8 monthly page views per user!
We’ll ignore that last part for now.
The point is that these ballpark numbers are not that hard to find as your competitors have to (or do) report on them publicly.
We can now calculate the derivative currency exchange rate or average revenue per user (ARPU):
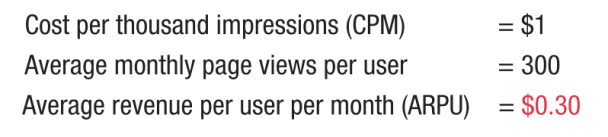
Notes:
- Facebook reports its ARPU on a quarterly and annual basis which are just 3x and 12 x the monthly ARPU number above.
- Check out this page for a list of Facebook’s business metrics definitions.
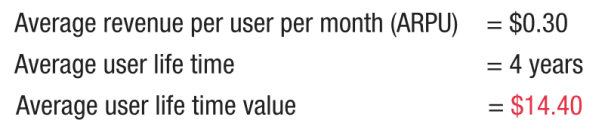
One last input will complete the basic model: the average user lifetime. I’ll assume that we’ll get students signed up as freshmen and keep them for at least their college duration — so four years.
This allows us to calculate the projected average lifetime value of users as follows:
Here’s the completed Lean Canvas with these numbers plugged in:
What’s Next?
Remember that a business model without a repeatable and scalable revenue story is a hobby, not a business. You need to be able to tell your business model story, even if just on paper, before starting the hard work of building it out and validating it.
Next time, I’ll extend the simple back-of-the-envelope technique for ballparking direct business models I described in this post to ballparking multi-sided business models where you’ll be able to test whether these numbers are good enough (or not) to start pursuing this business model.
